Designing for Businesses
Hawthorne Advertising
After pioneering the infomercial, Tim Hawthorne founded Hawthorne Advertising. A strong history and impressive clientele made Hawthorne Advertising a cornerstone in the industry. I had the honor of designing products for clients like Apple, Nissan, and Nestle.
Seraph
I was in charge of designing and managing a massive data science that included multiple products. My team consisted of developers, business intelligence specialists, and data scientists. I was the sole product designer at Hawthorne, so integration was key to success.
Products
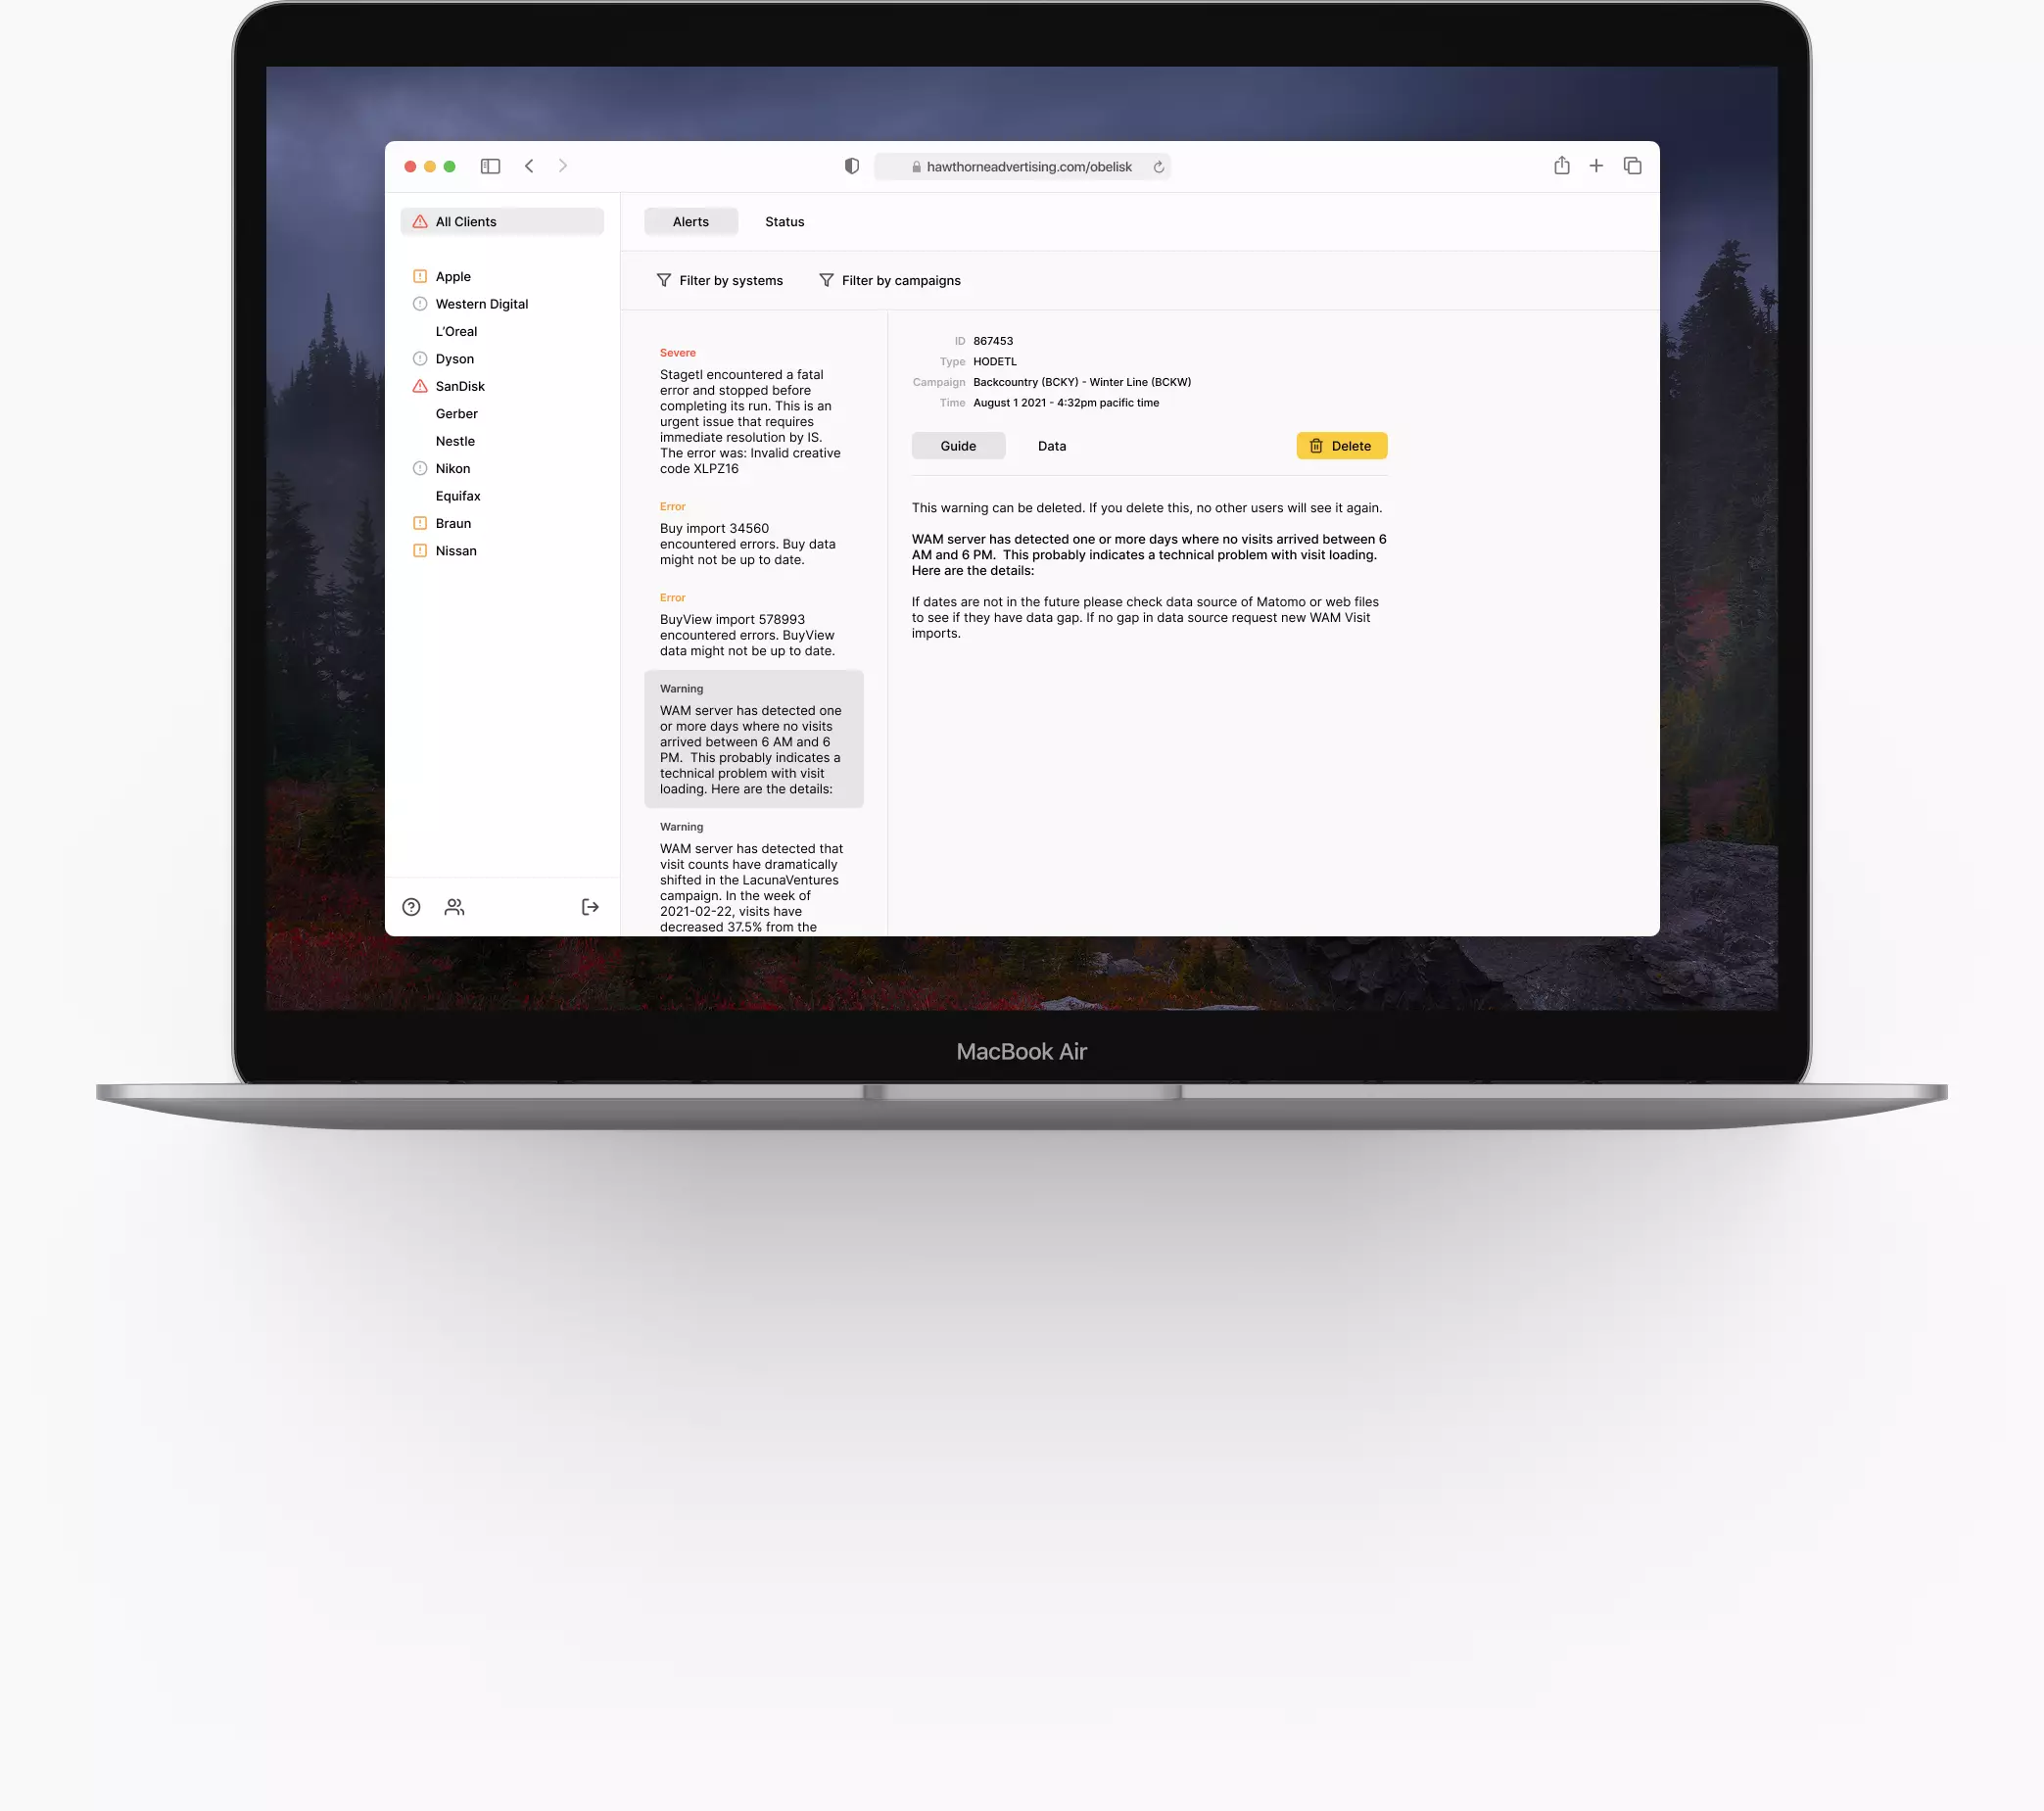
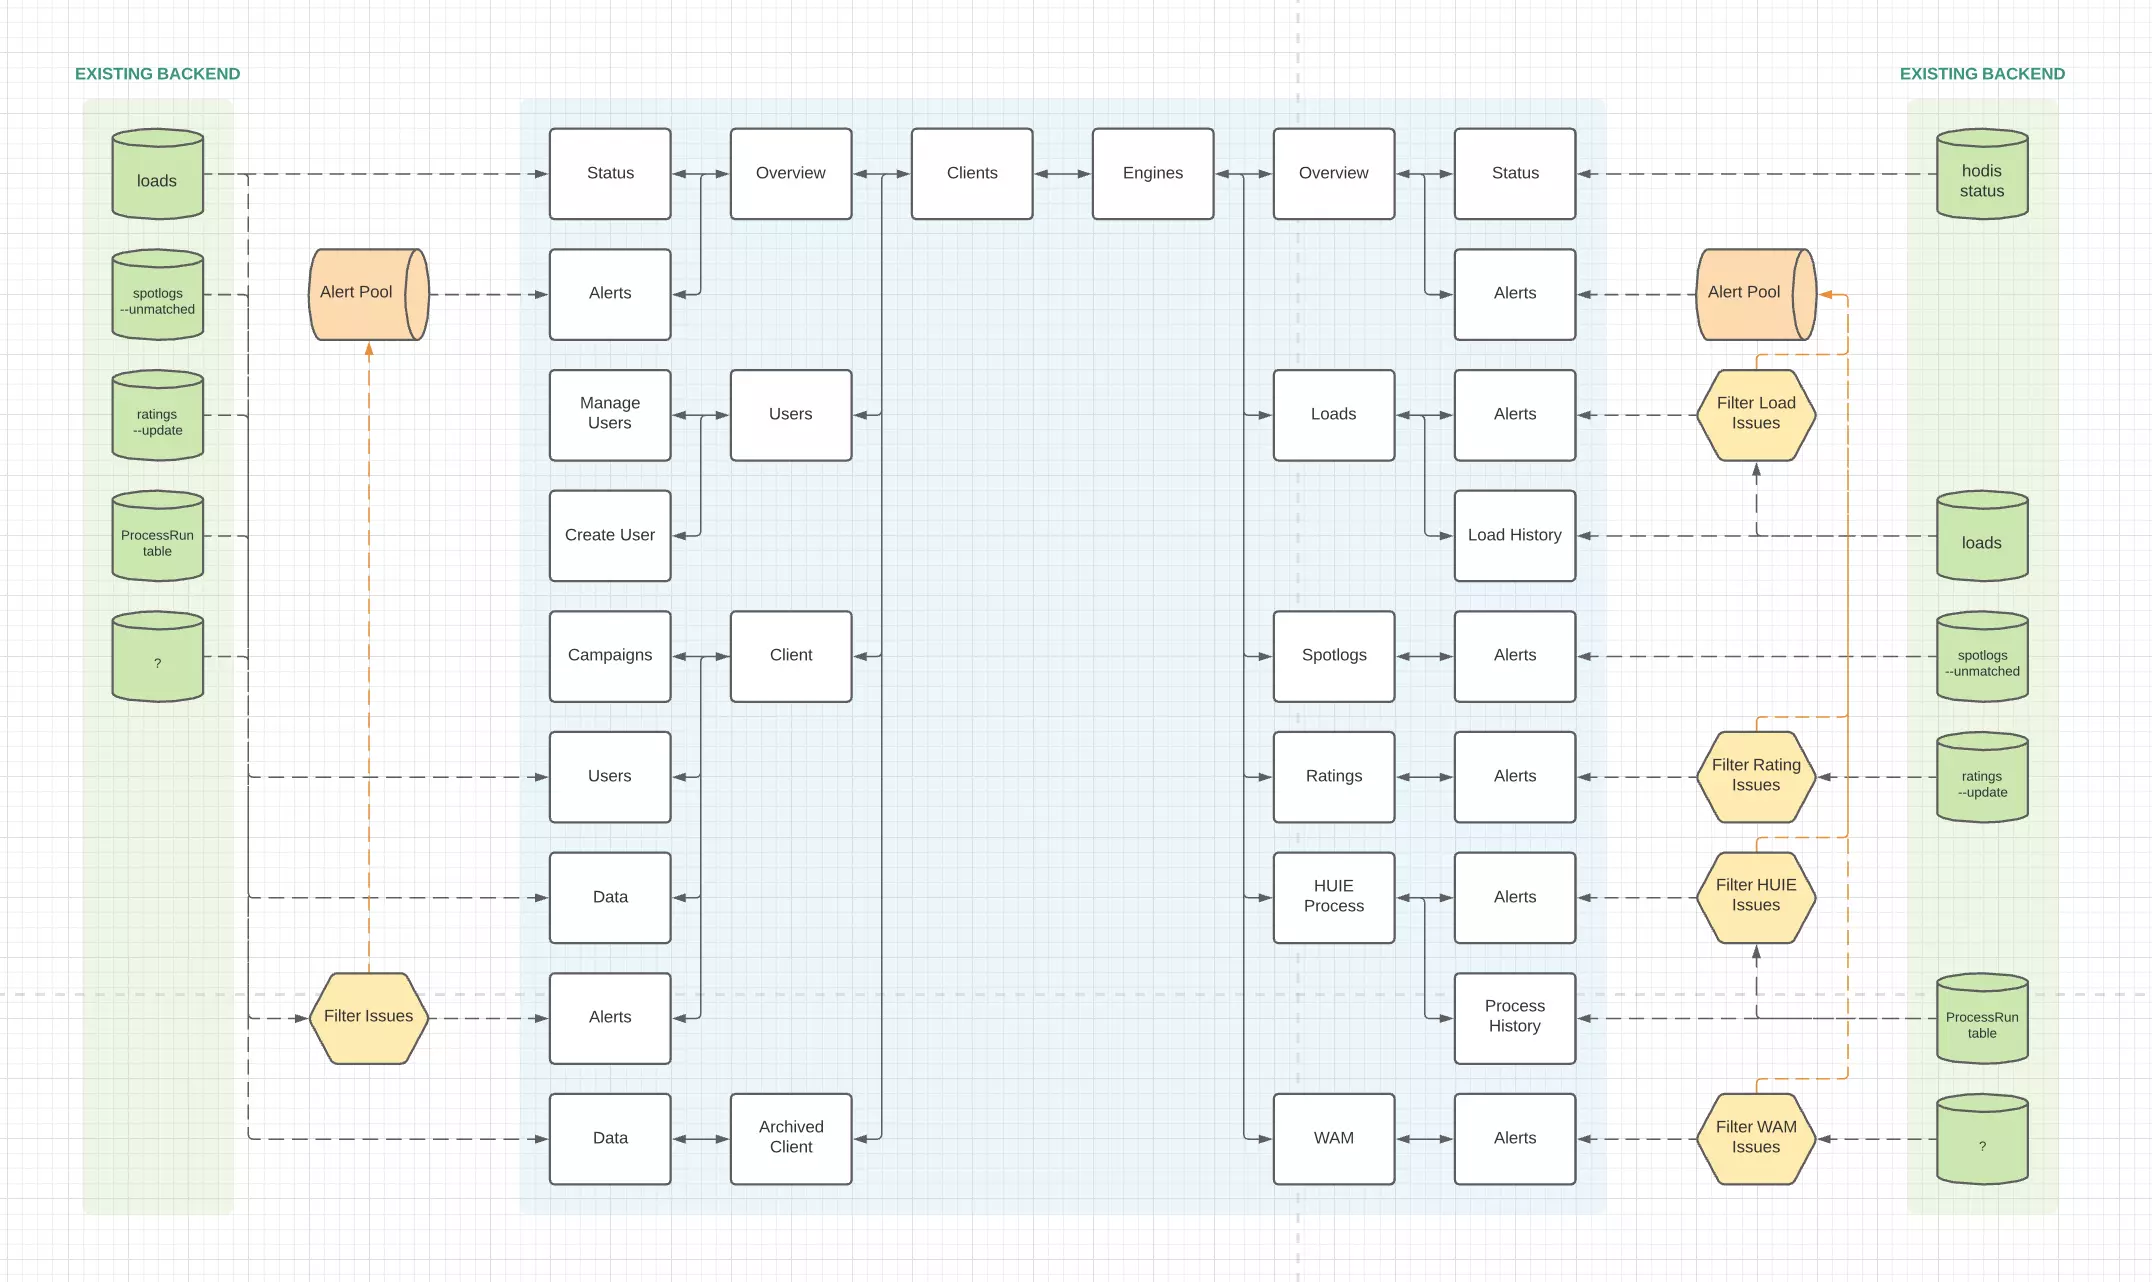
Hawthorne Obelisk was a web app we used to manage our entire backend. It was used by every department, so it serveed many use-cases and technical proficiencies. Version 1 launched in Q1 2021.
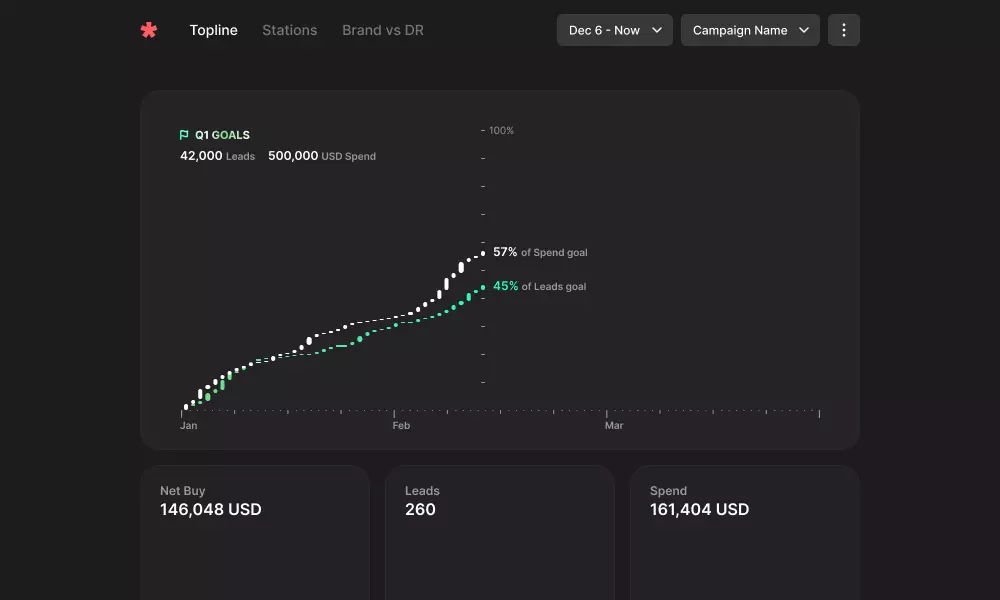
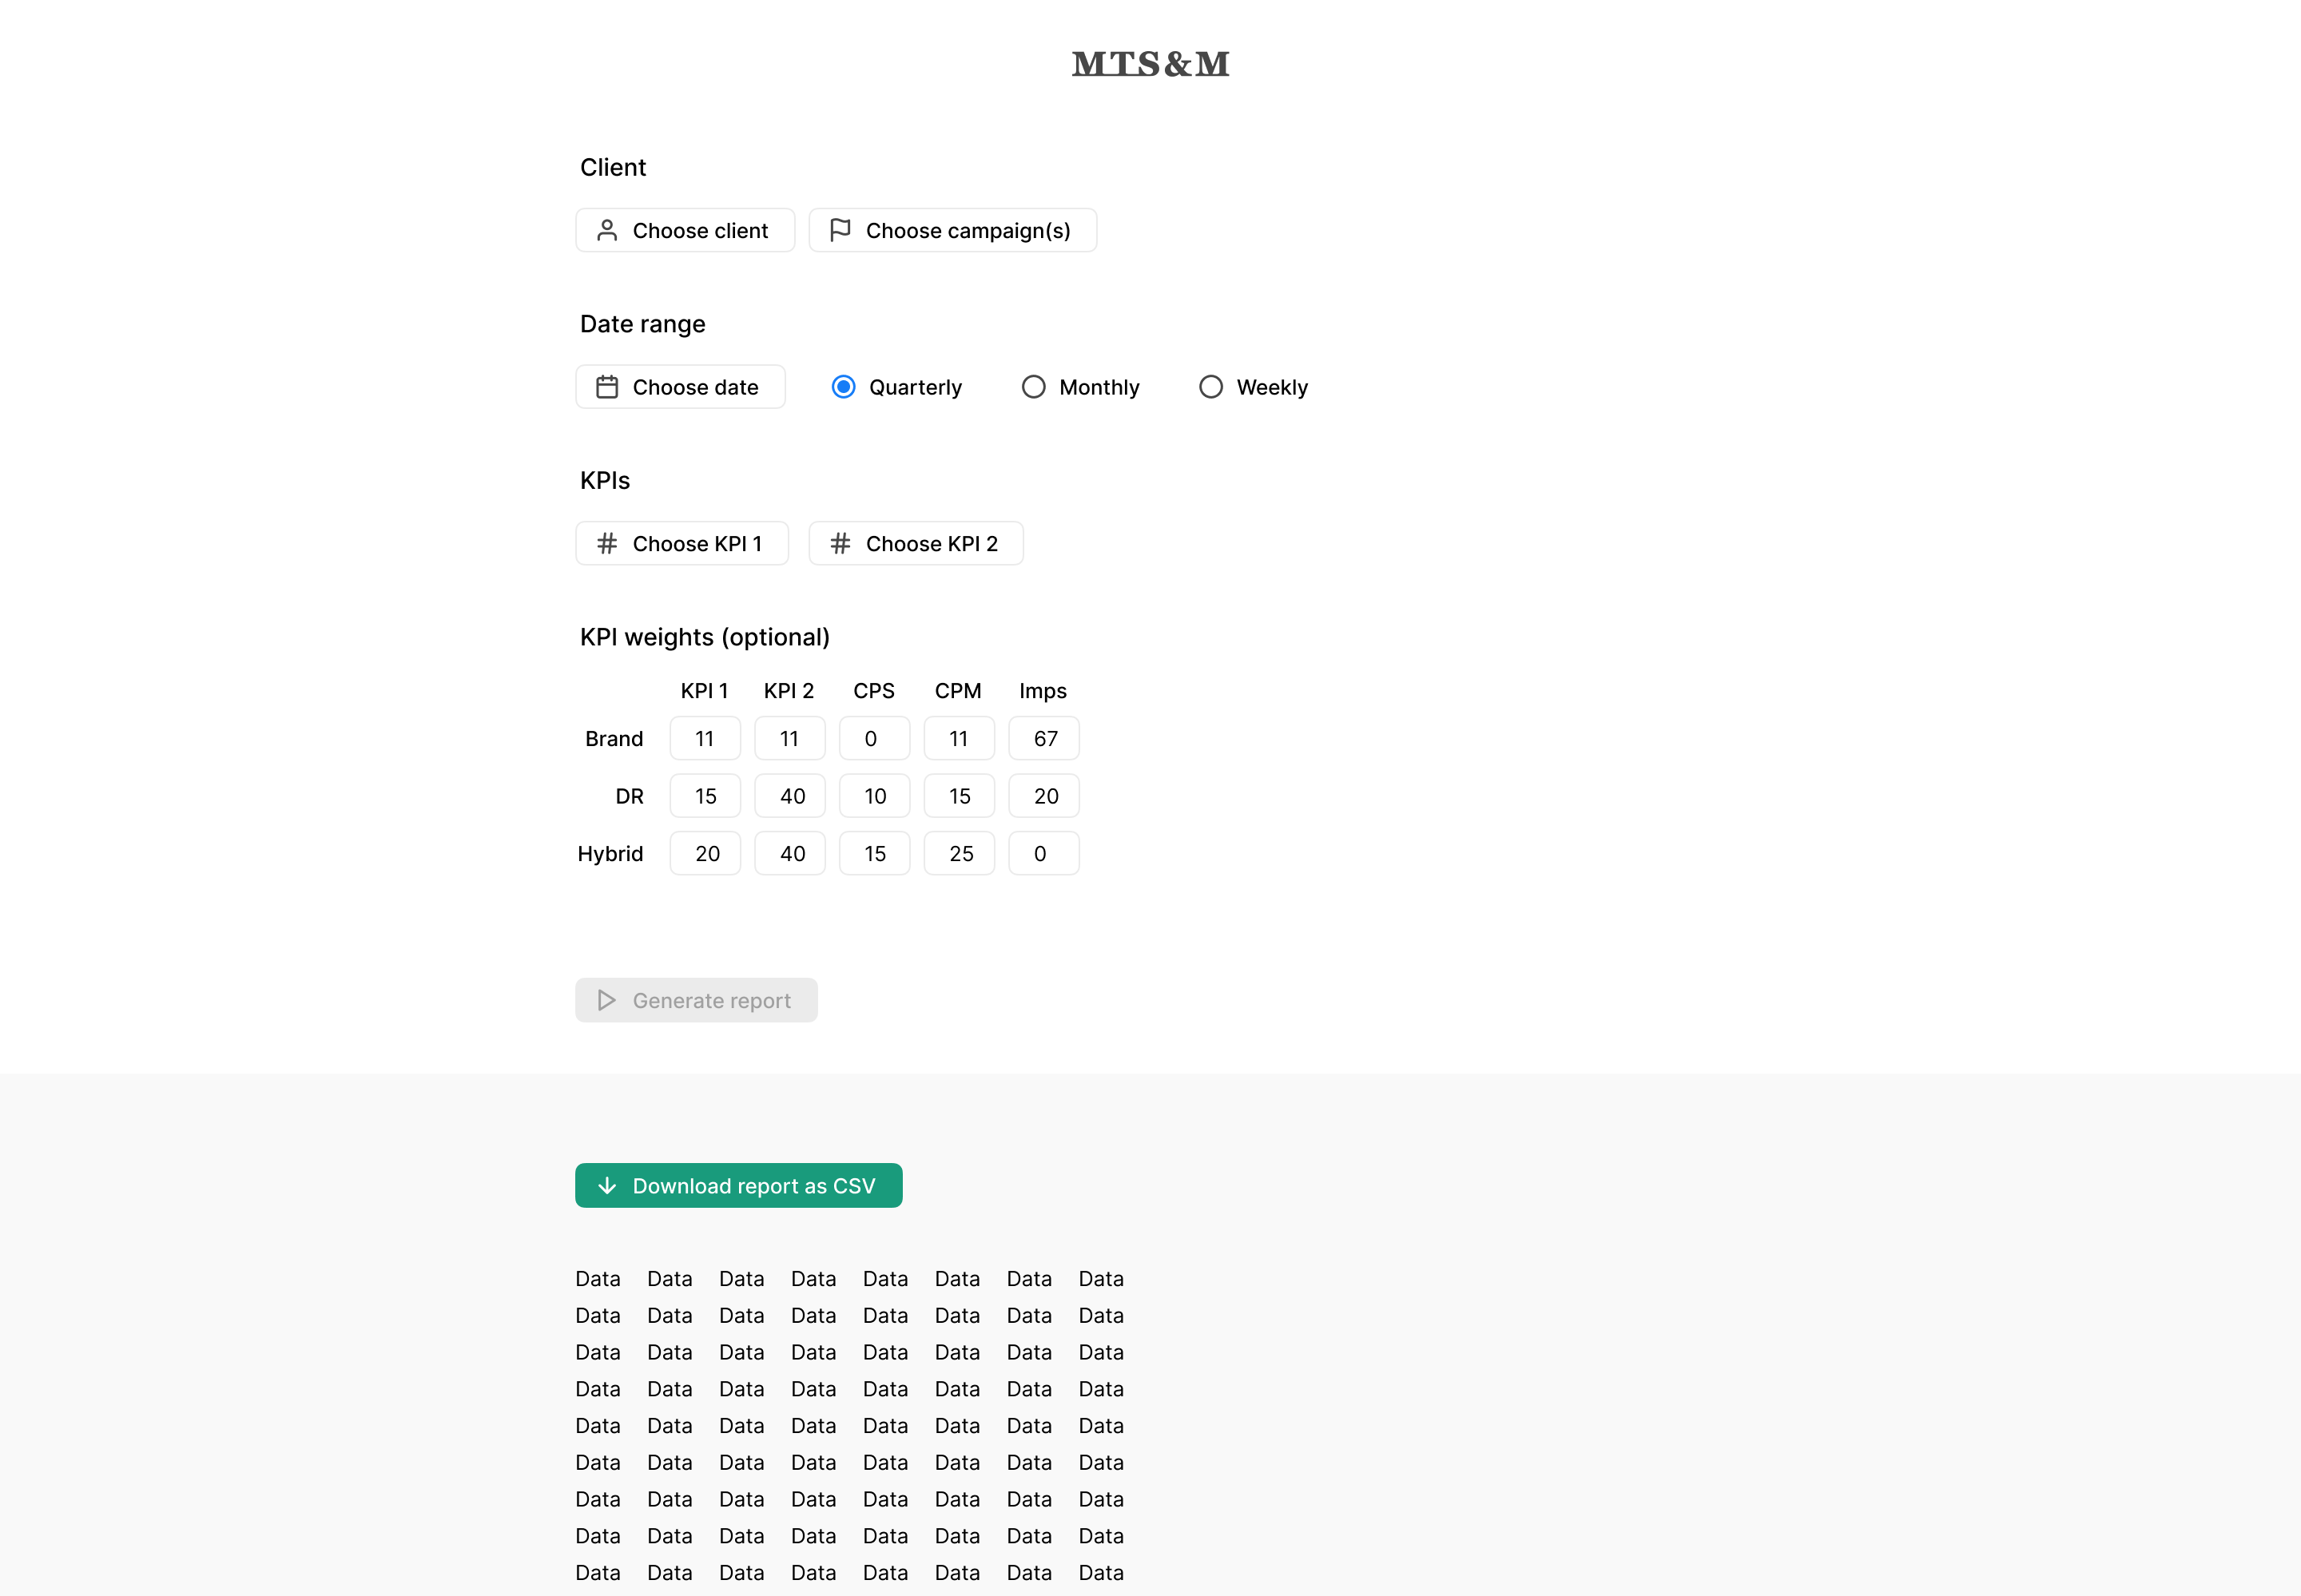
Hawthorne Asterisk was also a web app, but for our clients and client managers. It was meant to replace our existing reporting tools and dashboards. Clients and managers could track their performance once Asterisk launches in Q4 2021.
When I initiated both projects, I gave them their cute rhyming names. But oh boy are they mouthfuls during meetings. Try saying Asterisk and Obelisk like 15 times.
There were also smaller web apps that filled in the gap between Obelisk and Asterisk.
Connecting us
Our employees said the backend made them inefficient. It’s not a great feeling when you have to fight with your tools. A 30+ year-old tech-stack serving a dozen different departments is bound to rack up UX debt. Designing around that was a Herculean task.
But it wasn't impossible. Hawthorne is full of super supportive people. Leaders from all departments attended my weekly design workshops. I guideed them through problem generating and problem-solving exercises.
It was a rounded way to gain insights and produce solutions considerate of all users. Workshopping also organically taught people user-centered thinking.
Test & iterate
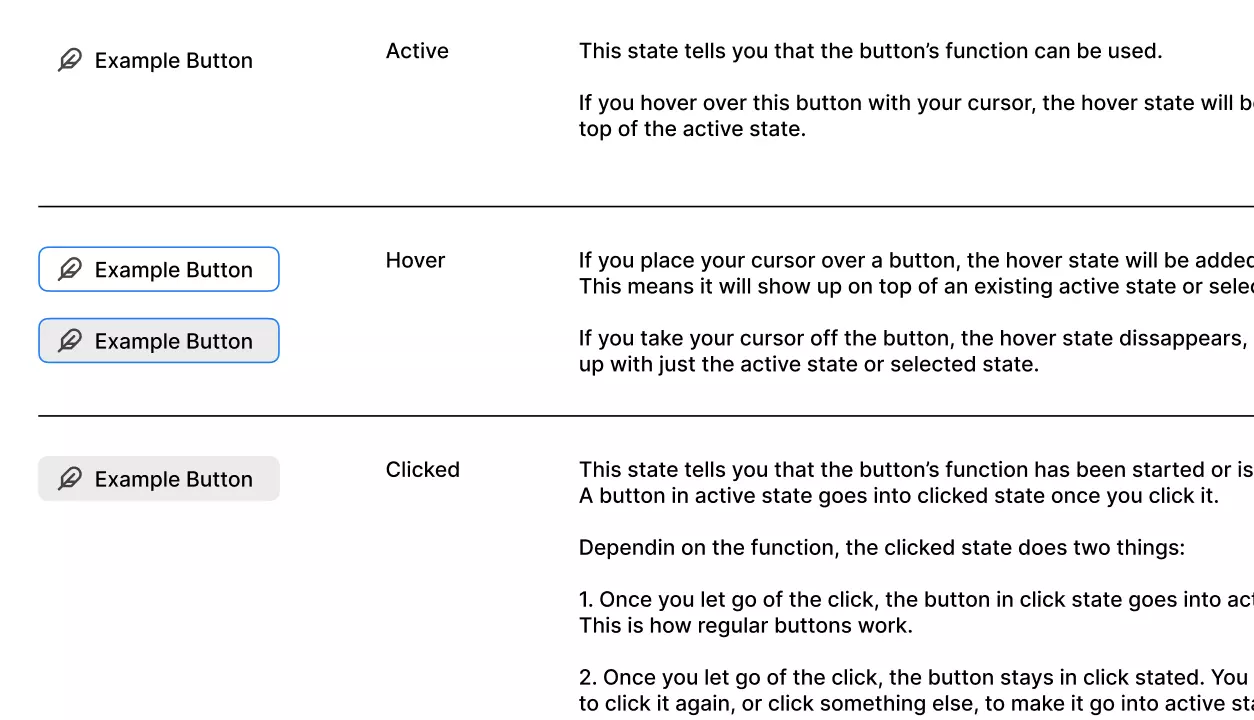
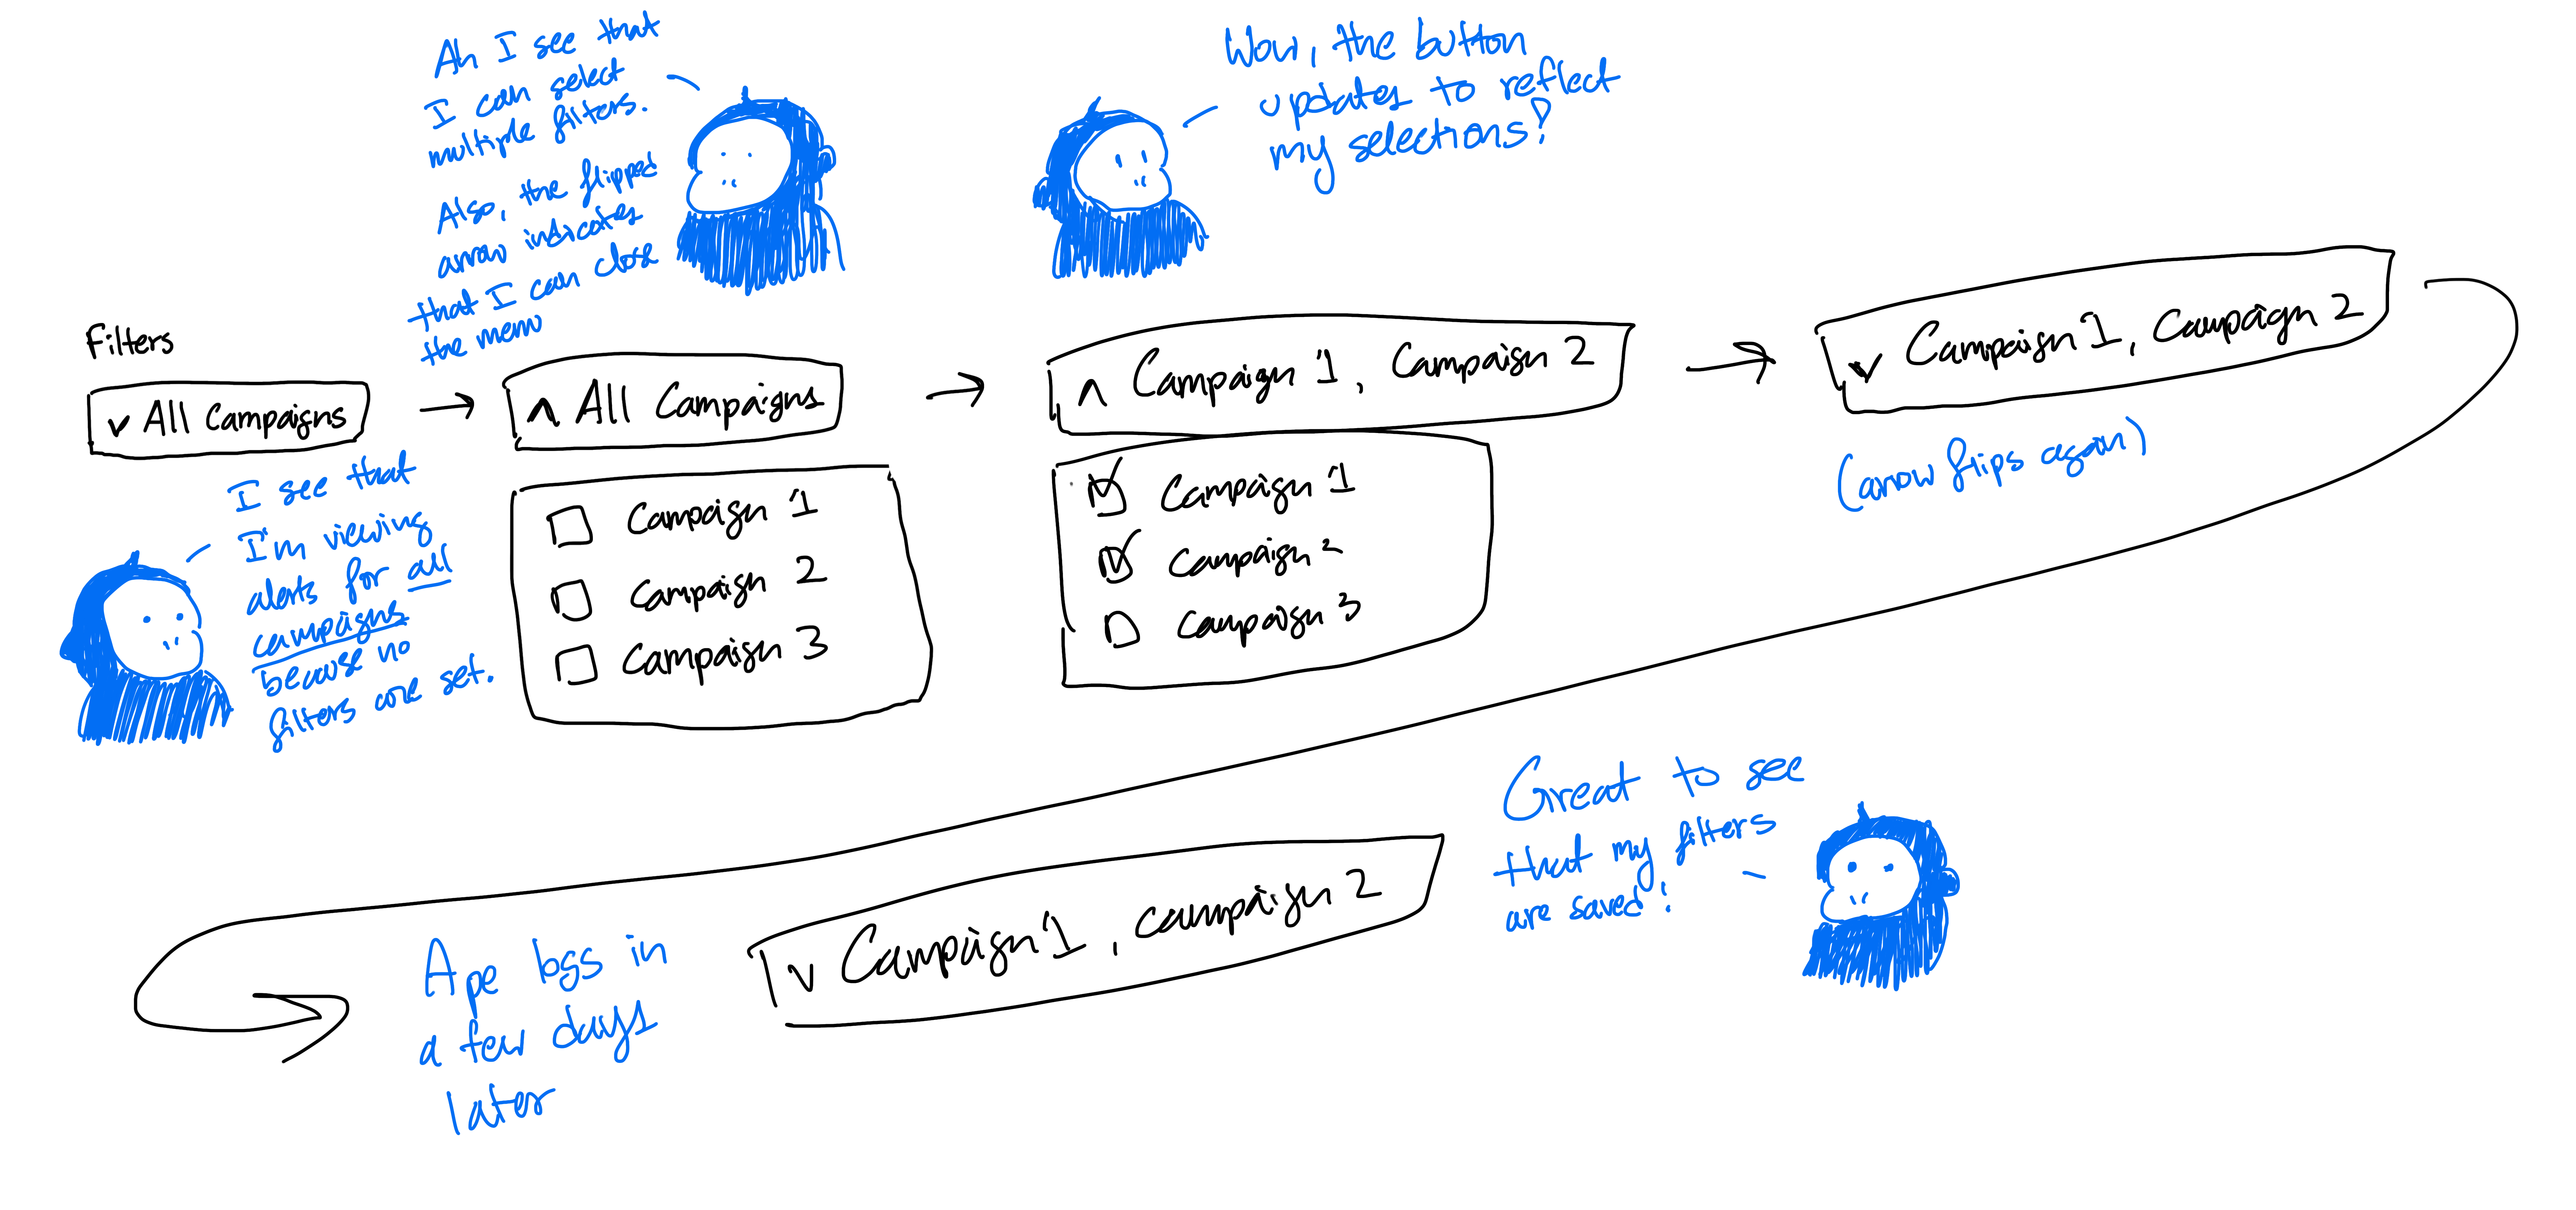
All new solutions are boiled down in scope. Small and fast solutions are integral to good testing and iteration. It enabled me to quickly whip up high-fidelity prototypes in Figma. When users think aloud while performing tasks on hi-fi prototypes, they have a lot more to say. There were also cases where I’d just slack mock-ups to users and ask for general feedback.
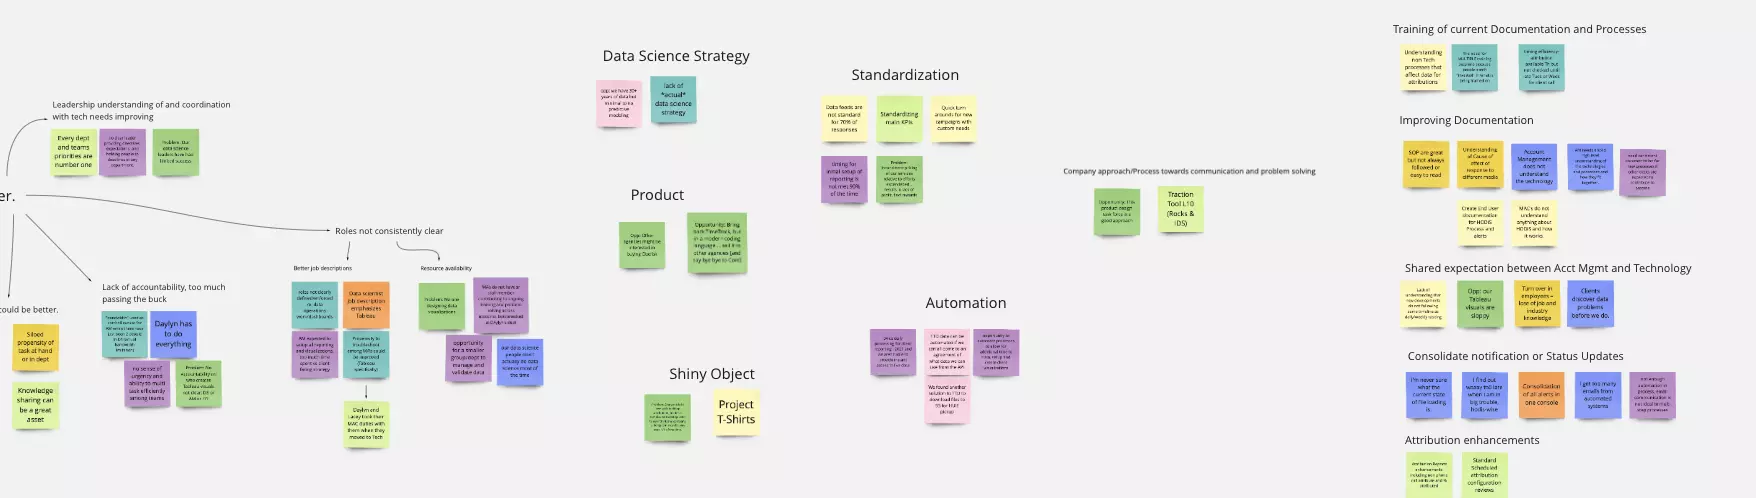
I conducted continuous exploratory research. It’s a fancy way of saying I had discussions with users, analyzed our existing tools, and asked our users to teach me how they interacted with the backend. And that was on top of my regular exploration of design in general.
Business stories
Unlike Obelisk, Asterisk (I told you it’s a mouthful) didn't run on user research and testing. I was asked not to involve clients in the design process until Asterisk launches, for reasonable reasons. It was unfortunate because the abstract goal of creating stories out of data reports was nebulous... at first.
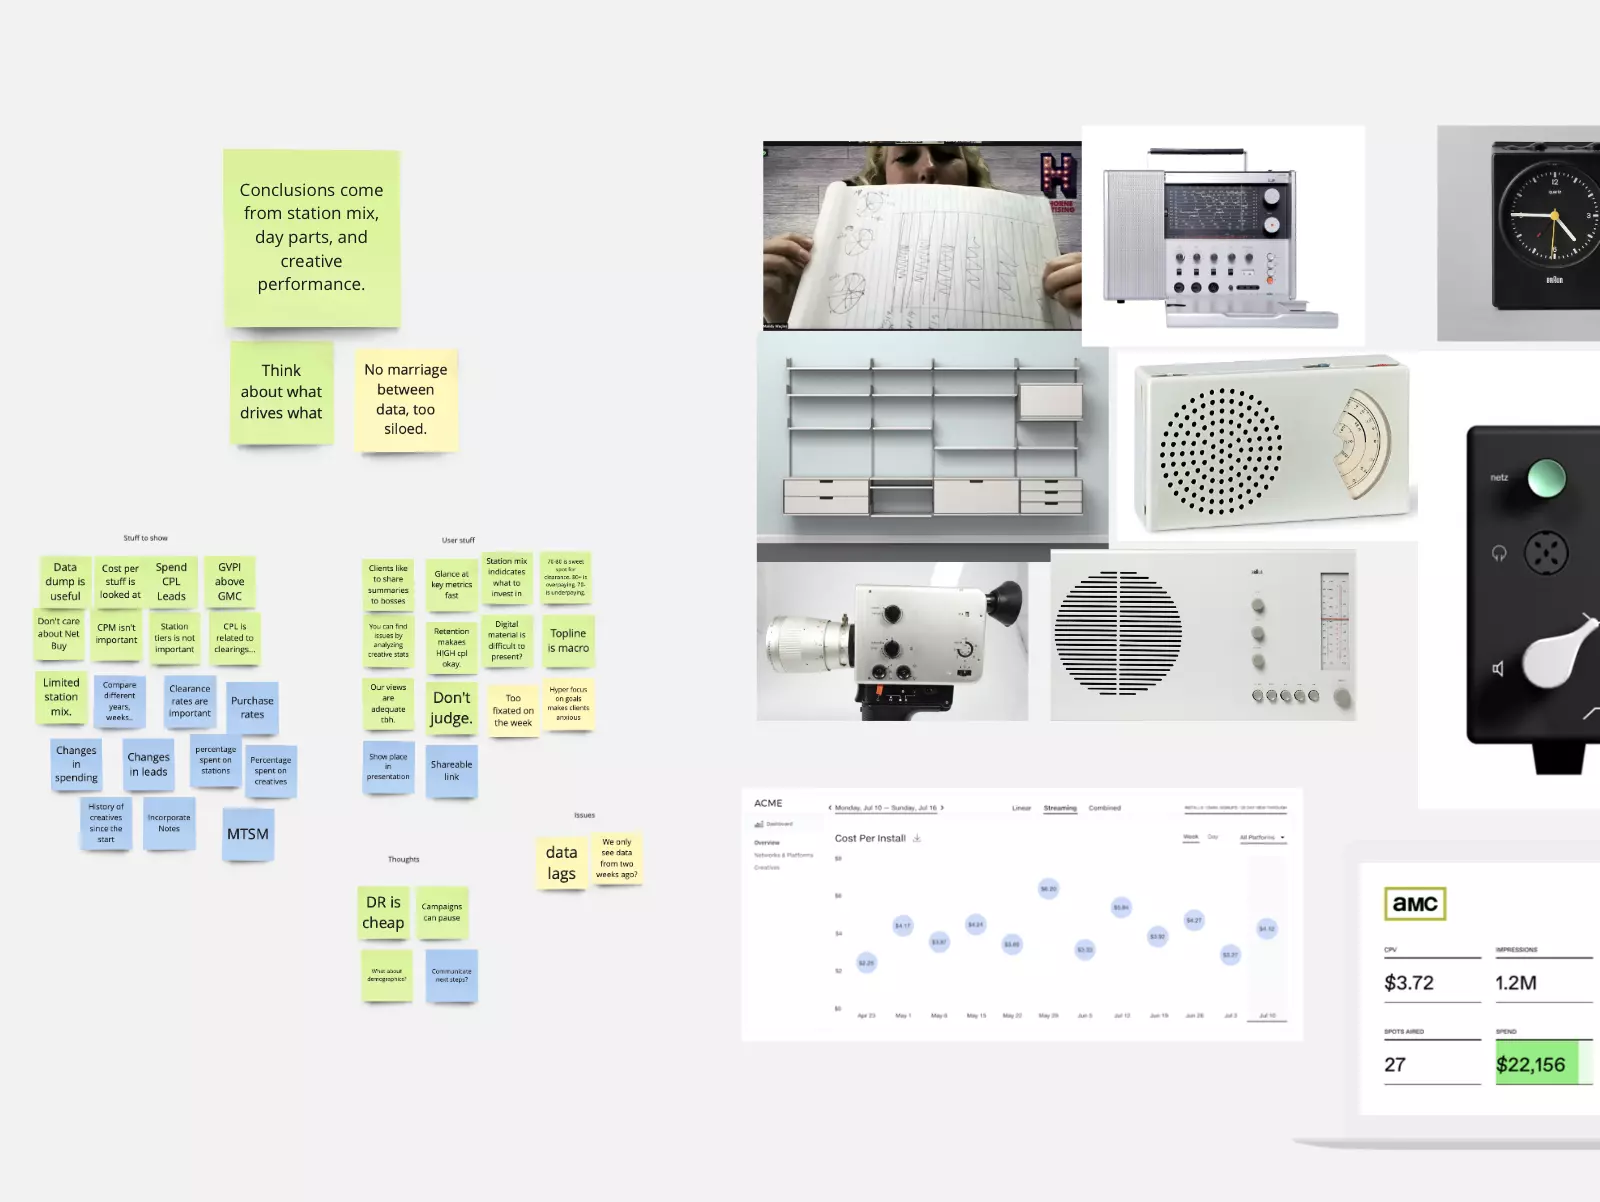
I silently observed weekly meetings between clients and client managers. Our client managers liked spreadsheets, but they didn't like our existing data visualizations. They thought granular tabular data told engaging stories. Our clients liked data visualizations, but they didn't like our spreadsheets. They thought concise overviews of progress and trends told engaging stories.
They both wanted the same thing, but their disagreement on the medium created disappointment.
We live in a society
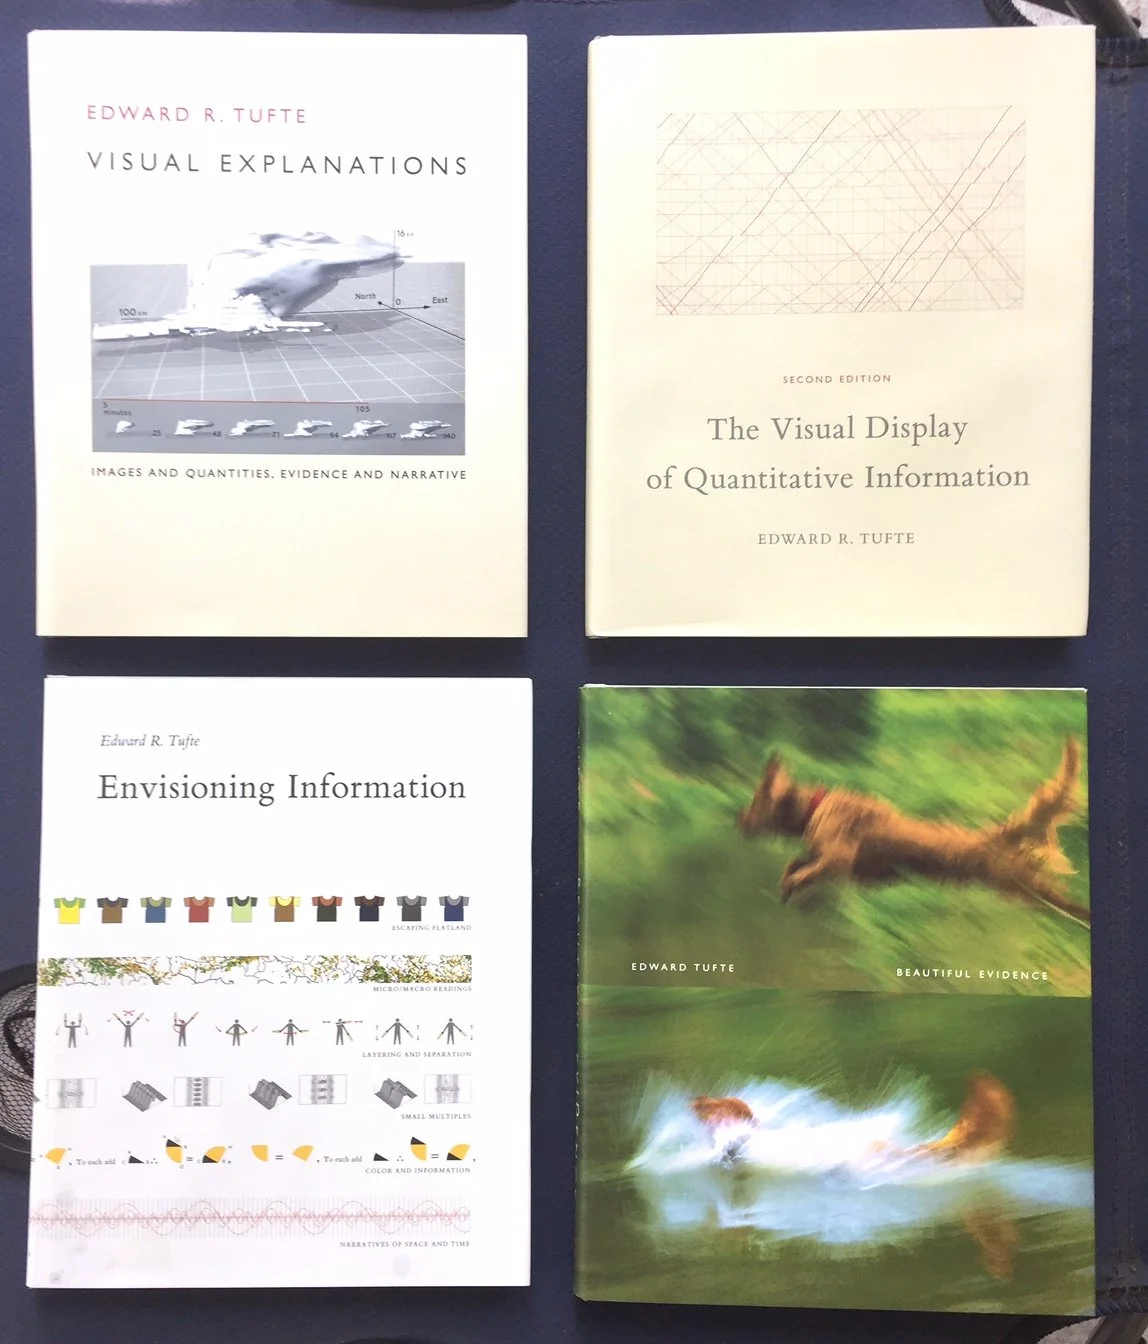
According to statistician Edward Tufte, we as a society are not good with data visualization. Pie charts have poor UX, bar graphs lie through scale, and we never show what's only necessary. I poured through Tufte’s books to understand visualizations that satisfy both my user groups' needs.
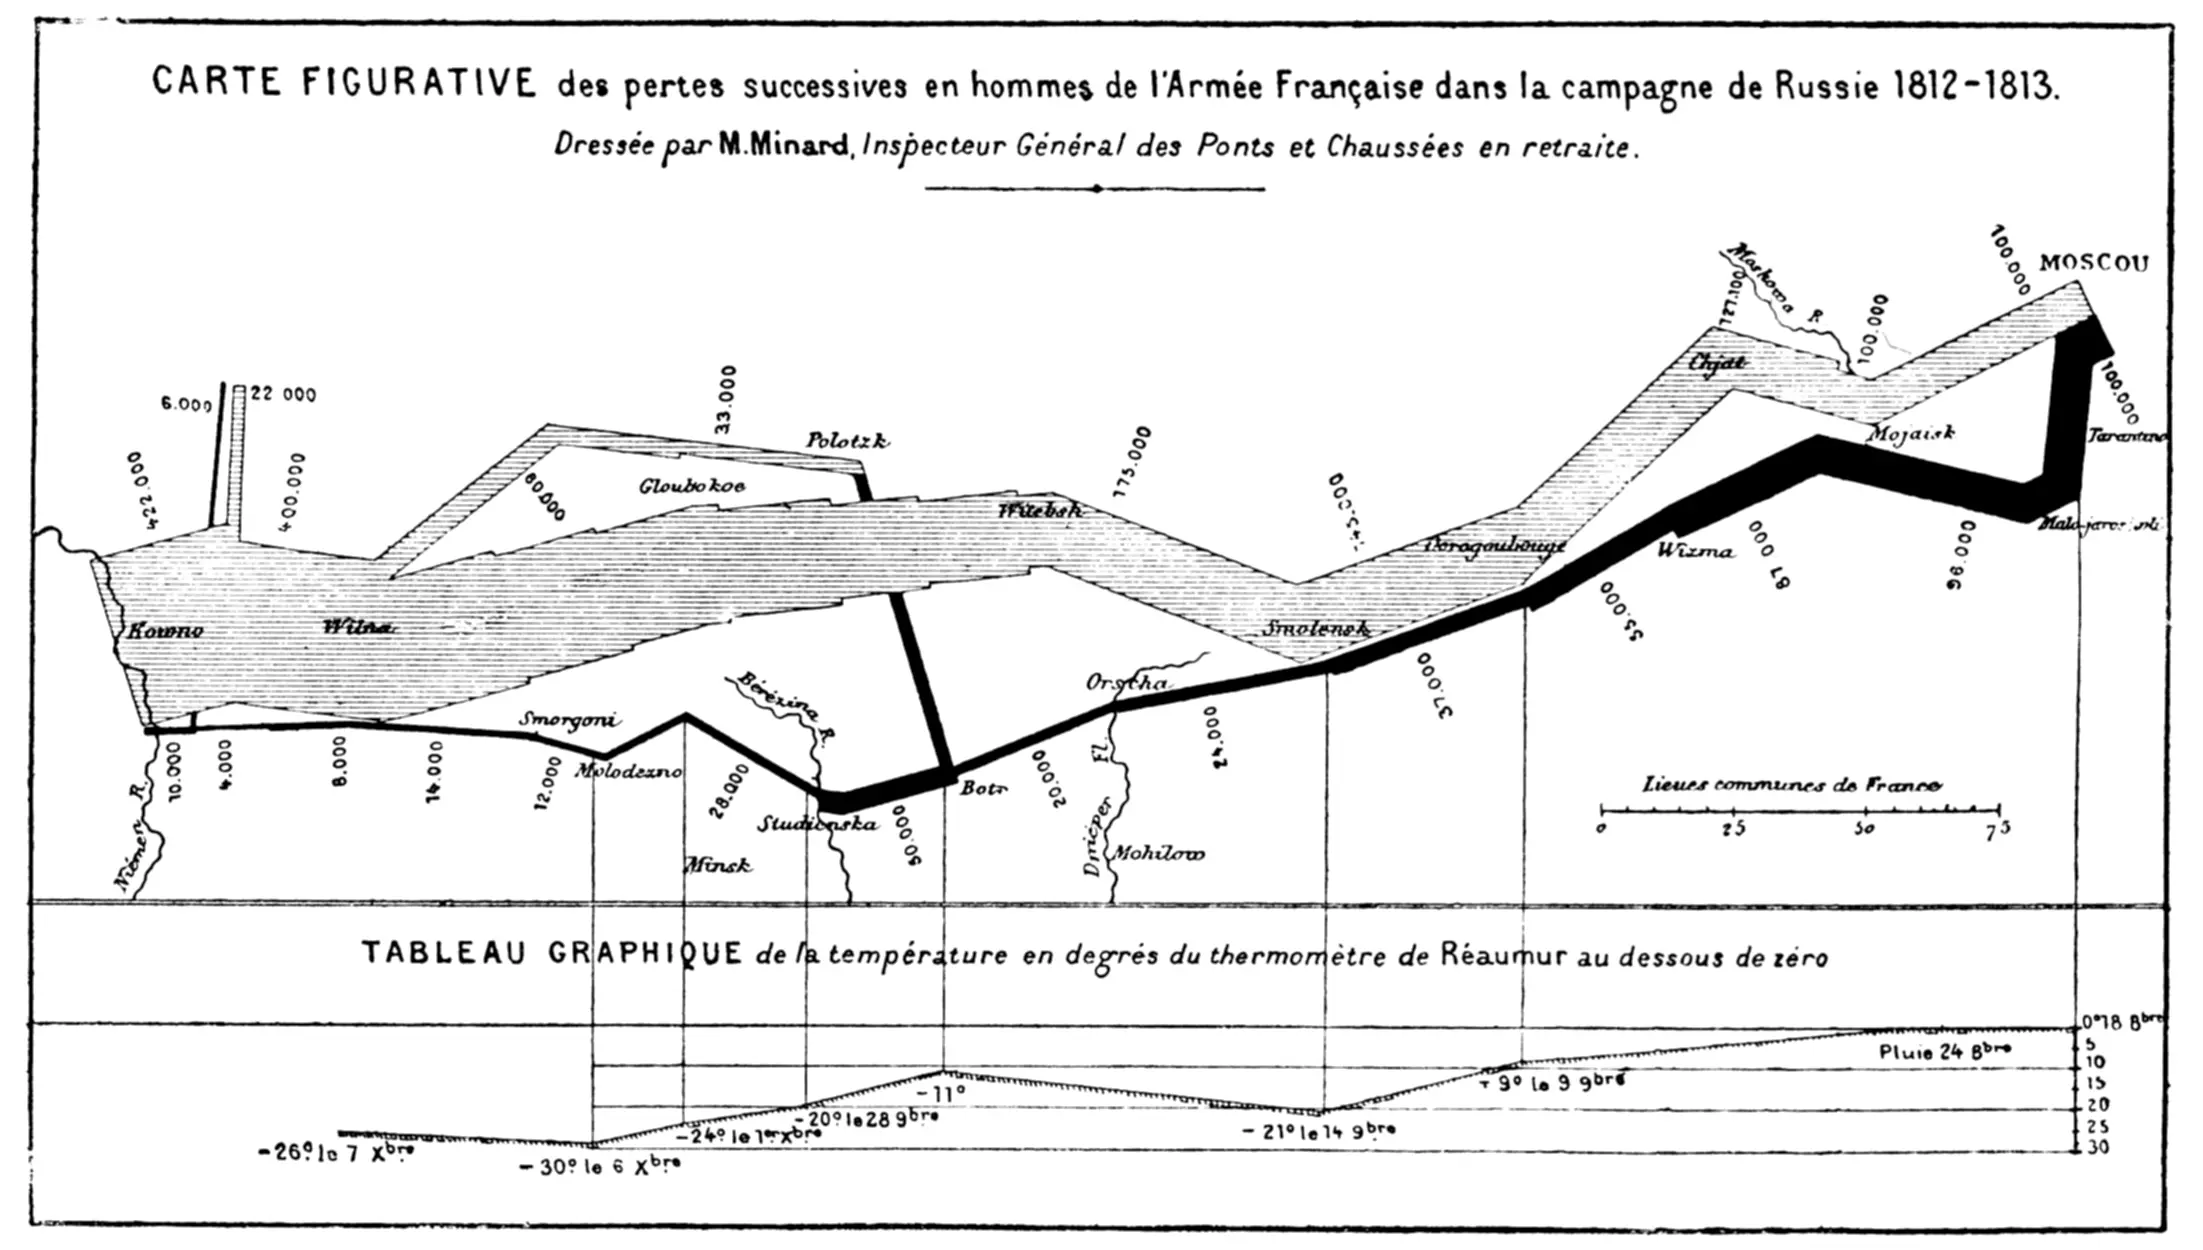
Napoleon’s march is our golden standard. The relationships between multiple granular metrics give rise to concise stories. It should satisfy both our clients and managers.
In progress
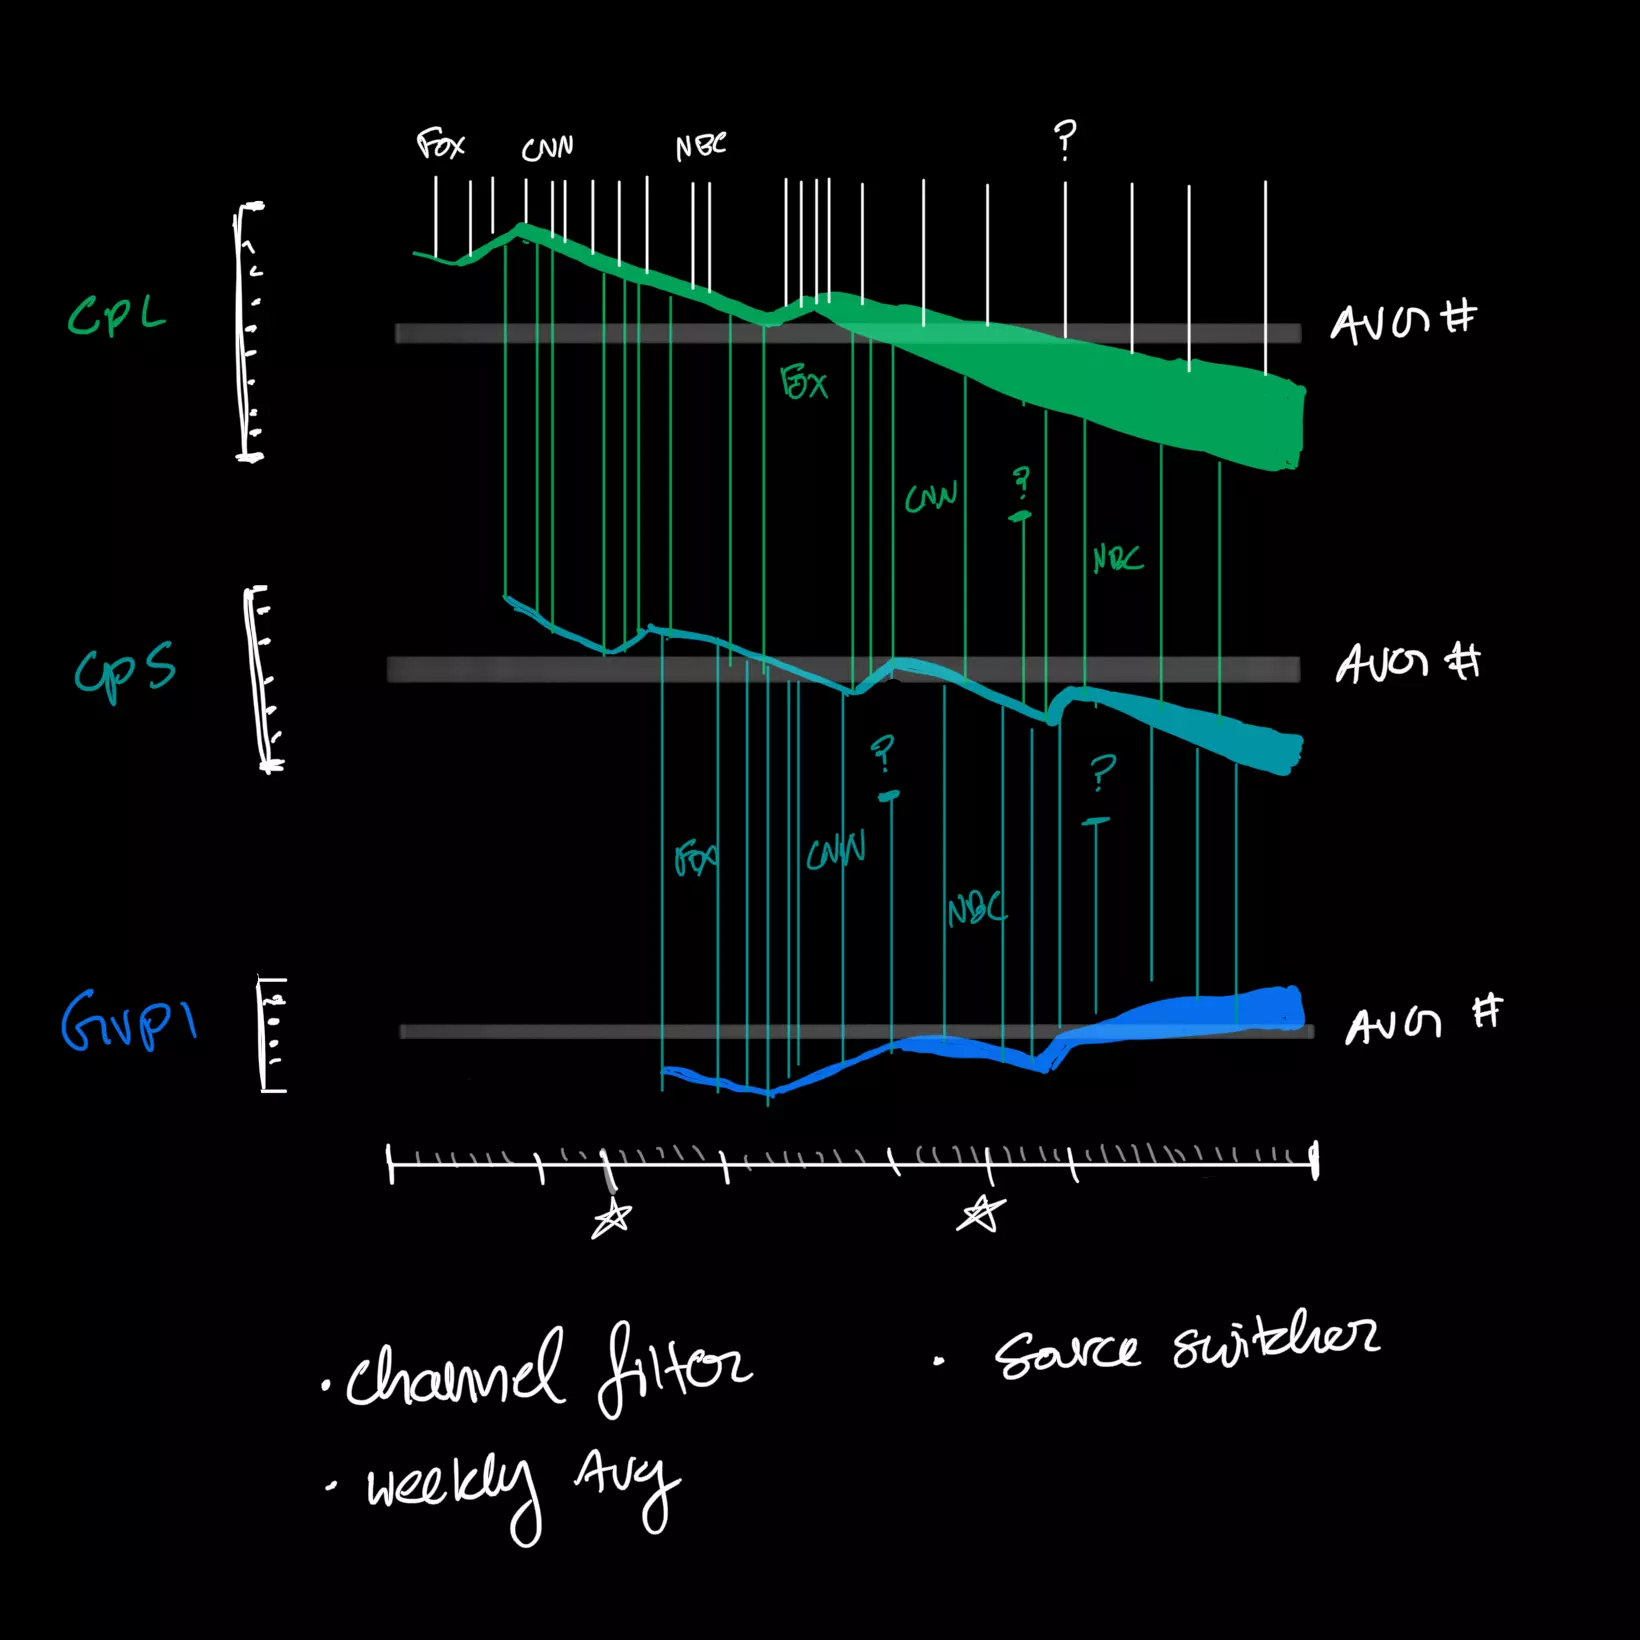
Inspired by Russia’s winters, my team brainstormed and sketched all kinds of intricate graphs. The client managers were excited by our concepts because they opened doors to more efficient and comprehensive strategizing.
Sadly, we discovered that our backend just wasn't able to create these data visualizations. The hope was that Obelisk would give us the tools we needed to advance our backend to make Asterisk a reality. At the time, we used Tableau's API to power basic visualizations.
Towards the future
User-centered development (is that a thing?) can lead to great product support. Which is why I stepped up to be the manager. It turned out we're actually all interested in pursuing tech that improves UX across the board.
I introduced lean development practices to the team. We tested and iterated a new backend architecture that will make Asterisk a data visualization powerhouse. It’s going to enable processing and connecting interesting points like political data and weather data.
Because of my development and data-science experience, I was initially bridging team members by communicating their expertise to each other. But the workshops, passion projects, and our vision for the products made us quite harmonious.
Home